


When we start using Dynamics 365, the baseline will be PPAC – Power Platform Admin Center, which consolidates different options available at the moment. For example, admin portals, maintenance, monitoring, analytics, and more.
With 2021 waive knocking on our door, the console has been enhanced at different levels, letting users gain a better experience utilizing the PPAC. Let’s delve in and have a look at them, shall we?
Console Enhancements
Security Roles Management
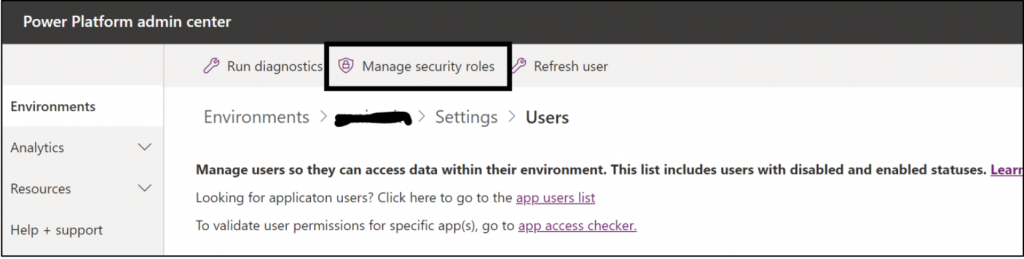
There is a new feature available since June which is managing security roles. The feature basically enables you to manage security roles for their users directly through the user settings page in the Power Platform admin center. In old times, security role management could only be done through the security roles page.
Hence, all you need to do is access the environment, go to Environments > settings > Users, select the user to manage, and finally click on the “manage security roles” button to open up a box with all the security rules available in the system. From that point, you can select the preferred option.
Application Users Management
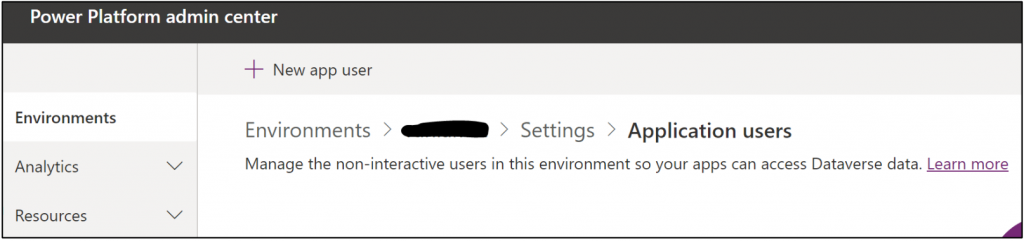
Now, it is possible to manage application users through Users + permissions option. That means you are able to manage all customer-created application users here. However, needless to say, that Microsoft first-party app users can’t be updated and won’t be shown here.
PPAC Environment Settings Modernization
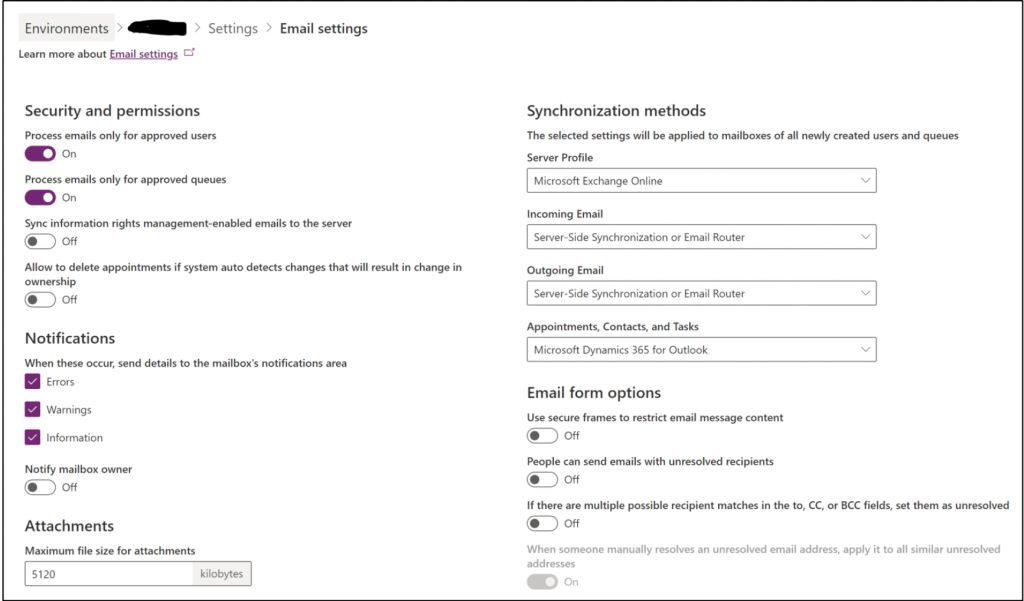
Finally, PPAC environment settings. The update supercharges you to configure email server profiles through the modernized user interface without being redirected to the legacy web client interface. You have access to your environment settings where you can configure the synchronization methods to select the seller profile to use, incoming/outgoing email, and the method to be used for appointments, contacts, and tasks.
DLP Data Loss Prevention Enhancements
Custom Connectors
With the 2021 release wave, the MS team plans to provide organizations with support to define unordered access control lists to classify custom connector host URL endpoints as Business, Non-Business, or Blocked at a tenant level.
Eventually, this will allow us to see a new tab in Data Policies with Custom Connectors page, allowing users to specify a list of allow/deny URL patterns for custom connectors.
Needless to say that individual custom connector classifications for environment-level policies that use Power Platform admin center user interface (UI) are also supported. Custom connectors that have never been specifically sorted will be included in a default group.
Action Control
Admins can safely switch on business use cases through Microsoft Power Platform with the power to control specific actions for the connectors without the necessity to shut off the entire connector in the environment case.
Hence, Microsoft has provided an ability to allow or deny individual actions associated with a connector as a fine-grained control in addition to the existing Business, Non-Business, or Blocked support in Microsoft Power Platform data loss prevention policies.
Endpoint Filtering
With the update, organizations will be provided with support to define an allow-deny list based on pattern matching to control which endpoints are allowed or denied through specific connectors, such as Microsoft Dataverse, SQL, Azure Blob Storage, HTTP or SMTP.
(Have in mind that specifying anything at the tenant level, we are applying that to all the environments inside the tenant.)
PPAC Performance and Diagnostics Monitoring
The next thing that comes with the update is performance and diagnostics monitoring, which provides insights analytics on errors and performance issues with Microsoft DataVerse and Model-Driven Apps.
With the data, your organization can improve user experience through better monitoring and production issues resolution, as well as proactive maintenance. In addition, since the platform log data is available – in many cases, it will reduce the need for teams to write custom code for errors and performance.
To tell a long story short, you will be able to:
- Opt-in to the export production environment’s platform logged error and performance data for the unified interface from loads;
- Get way more insights, through both out-of-box and custom reports;
- Enable self-service and basically improve outcomes for different scenarios;
- Enjoy out-of-box reports with specific forms for user activity, allowing administrators to better understand adoption blockers and drivers.
Cross-Tenant Analytics
In regards to cross tenant analytics, the update empowers administrators to get insights on the usage with metrics like Monthly Active Users (i.e. MAU), including engagement with the return users as well as the list of applications in use/not in use at the tenant level. As for example, teams will be able to quickly get a snapshot of users entering matrix, which will help to flow resources into a heavily used application.
Moreover, admins will be able to opt into out-of-box tenant-level reports for Power Apps with an ability to drill down to the environment level.
Also, for environment-level admins, views are automatically filtered in order to only include the environment they actually manage.
Telemetry Data Export to Microsoft Azure Data Lake
Using your own Azure Data Lake allow you to slice and dice the data based on your unique requirements, so you can build custom reports including views at the individual business unit level and detailed up level reports at the tenant level and the environment level.
The fact that you are going to have the data in your own data lake means that you can store it for the duration of satisfying the organization’s arbitration policies requirements.
Looking at the feature itself, you can opt in to export all your tenant data into your own Azure Data Lake Storage instance without having to write any code. Having your data in your data lake superchargers you to leverage Power BI dataflow connecting it to Azure Data Lake Storage and start building reports and dashboards the way you like.