

Starting with the current challenges with Finance and Operations monitoring, we should probably address the lack of insights right away. Primarily, customers have been needing to get insight into their ERP environment, especially as we move AX system from on-premise to the cloud, evolving it into the Finance and Operations suite of apps.
There is a need for rich insights into who’s using the application; who it’s been used for; where are the failures. Because of the gap, MS users and partners are building some custom logging capabilities. More often than not, practice shows that logging a whole bunch of data into the live production system, unfortunately, will cause a lot of storage bloat and performance issues of its own.
The same negative effect will be applied if you are trying to copy your environments from other implications, say, production to the sandbox, or even all the way down to the development. We’ve seen some of these custom tables were so large that other types of issues were triggered as well.
Last but not least, we also hear from our customers that they need more flexibility and creativity within this – to be able to have smart detection; to build alert rules on certain conditions; conditions that can be auto-healed or self-mitigated; etc. so once there are any occurring problems you can go solve and put out the fire. Or, if it is a type of issue that’s coming from the base product or some kind of an infrastructure problem, you can be proactive about reaching out to Microsoft – even if there are their own detection frameworks.
So these are some of the current challenges being addressed by the MS team to solve with this new feature – monitoring and telemetry, which is leveraging application insights.
What is Azure Application Insights?
Let’s talk about what is Azure application insights. It is a feature from the Azure portfolio of capabilities (an extension to a base capability called ‘Azure Monitor’) and Azure Application Insights is primarily designed for web app monitoring.
When you are building web applications, MVC-type apps, .net programs, you can easily integrate with app insights. It is just an SDK and a nugget package that you can add to your solution and essentially it gives you a whole bunch of capabilities – almost for free or automatically.
It monitors which pages are being viewed; where your exceptions are coming from; if you have dependency type errors from the database availability – you can have availability testing overall just to see what’s the health of your environment from different geographies around the globe.
You can build smart detection and rules so that you either get a text message or an email or you can create a ticket in your own help desk ticket system.
There are also integrations with source control and release pipelines from Azure DevOps or GitHub actions so that when you are doing a release of new capabilities of your own code you can mark those as a point in time in App Insight to can see whether it’s actually making your system healthier or not.
Monitoring and Telemetry with Applications Insights
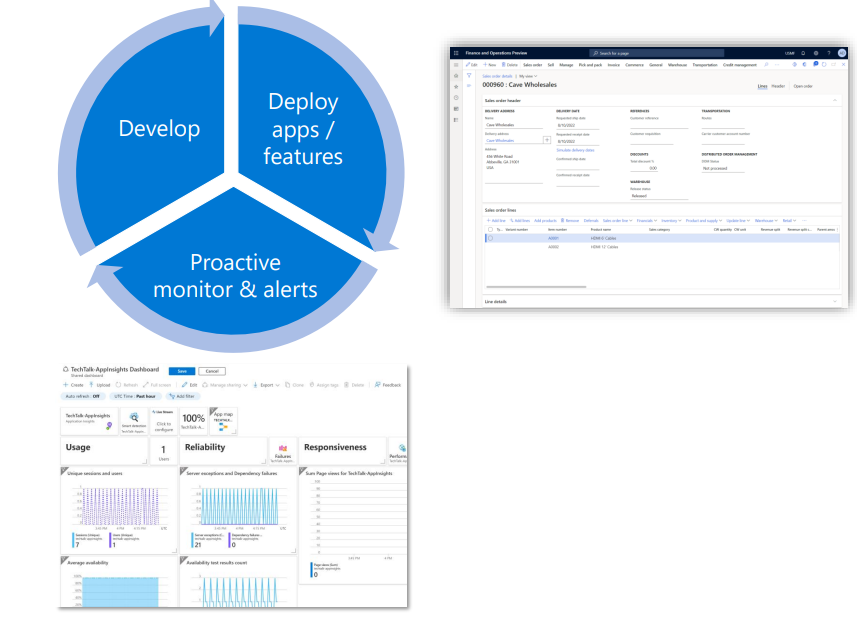
Let’s have a look at where monitoring and telemetry fit into the overall paradigm of Finance and Operations, including the life cycle. It is kind of an integral part of how you do things since 99% of all customers are customizing their F&O system to make it tailored to them, deploying apps or customizations, enabling new features as well as adding IS solutions you want to monitor how those are doing.
You want to be able to see and know quantitatively that the environment is healthy and the rate of failures is declining or staying around 0.
Based on the above, any kind of anomalies or errors you can bring back into the development cycle. But it is not just for solving problems, we also see customers needing this kind of data for assigning priority to their development efforts as well.
And so if you are being asked by your own stakeholders to build 3 different customizations, you can clearly see one area of the system has low utilization (like maybe only two people visit a specific form. Meaning, why to spend time & resources on customizing that when you can customize and enhance a form that has hundreds of visits a day).
You can actually get usage statistics about different areas of your Finance and Operations system and use that to fuel your prioritization in your development (which feeds back into the whole life cycle). So we do see this an integral part.
What is Included within the Public View?
Let’s take a quick look at what does this specifically brings with a public preview for Finance and Operations.
Certainly, the first is bug fixes from the private preview for F&O, so we have some performance impacts and things like that we’ve since mitigated. It’s looking really nice compared to the private preview.
What it comes with out-of-the-box are several basic capabilities in terms of monitoring, page views, the form loads essentially, and several different X++ wrappers (X++ exceptions; X++ custom events; X++ custom metrics) to look at your exceptions. Where errors are happening in the system; the type of these errors (be it design or unexpected type).
In addition to that, you can certainly create dashboards and use all of the different capabilities to emit your telemetry using custom events. Such as setting up alerts, creating custom queries and using logging capabilities. You can also have custom events and metrics.
What is NOT included
It is not really designed to be SQL performance or performance monitor. This is not going to give you insights into the CPU, RAM, DTU, or blocking statements necessarily. These are not the duty of the X++ platform runtime and how we’ve integrated app insights into it.
In addition, this is certainly not a verbose database logging tool so it is not recommended to use it or try to extend, making it log a bunch of data into the database – this is not for audit.
Finally, is this replacing LCS / LCS monitoring? The answer – it is not. These are two parallel features and have two parallel sets of capabilities. They are complementary, where one is more looking holistically at the environment, and the infrastructure kind of the platform, and the other is more application monitoring usage statistics related. More insights into the application itself versus the hosting environment.
Monitoring and Telemetry vs Operational Insights
Another common question we hear is ‘what about operational insights that came with the commerce capabilities and were the first ones? What about SCM monitoring capabilities?’
Let’s make a step back for a second. What did partners and customers do since a capability did not exist for Microsoft? Well, they started customizing and building their own database logging solutions in their own telemetry monitoring systems. The same thing happened with the first party at Microsoft.
Application teams did lacking platform features to meet customers’ needs. Hence, the MS Commerce team built operational insights; the warehousing and supply chain teams built features for the warehouse app integration and they were doing a similar thing but in different ways. Obviously, that got expensive for everyone involved.
Since we have this platform feature (monitoring and telemetry) – this is the base to reconverge and recollapse everything back – this is the new go-forward strategy. All future app teams in investments will continue to expand on top of this.
You will see monitoring and telemetry continue to grow operational insights and these other capabilities that you have seen blogged about – they have actually been folded into this one feature as we write. So hopefully that helps kind of clear that up.
There are also native integrations for some warehouse events that are coming in a couple of platform updates.